ENDFACE TESTING
Made by Promet Optics

This is the 1st of a 4 part post from the white paper entitled “Variation in Linear Apex Offset Measurements of Angled Fiber Optic Connectors”. We will define Linear and Angular Apex Offset and explore how ferrule rotation in APC connectors can result in erroneous apex offset measurements.
Introduction
The three-dimensional surface profile of a fiber optic connector endface is typically characterized by three parameters:
- Radius of Curvature
- Spherical Fiber Height (Fiber Undercut/Protrusion)
- Linear Apex Offset
Telecommunications Industry Association document TIA-455-218 “Measurement of Endface Geometry of Single Fiber Optical Connectors” describes the steps to measure the endface geometry of single fiber optical connectors. The PROMET International White Paper entitled “Fiber Optic Connector 3D Metrology” further describes how these parameters are measured using an interferometer such as PROMET International’s FiBO.
When using an interferometer to measure the Linear Apex Offset of an Angled Physical Contact (APC) connector endface, certain conditions can result in significant variation in the measurement results. The purpose of this White Paper is to discuss the origin and characteristics of this variation and how to minimize it.
Interferometry and Endface Geometry
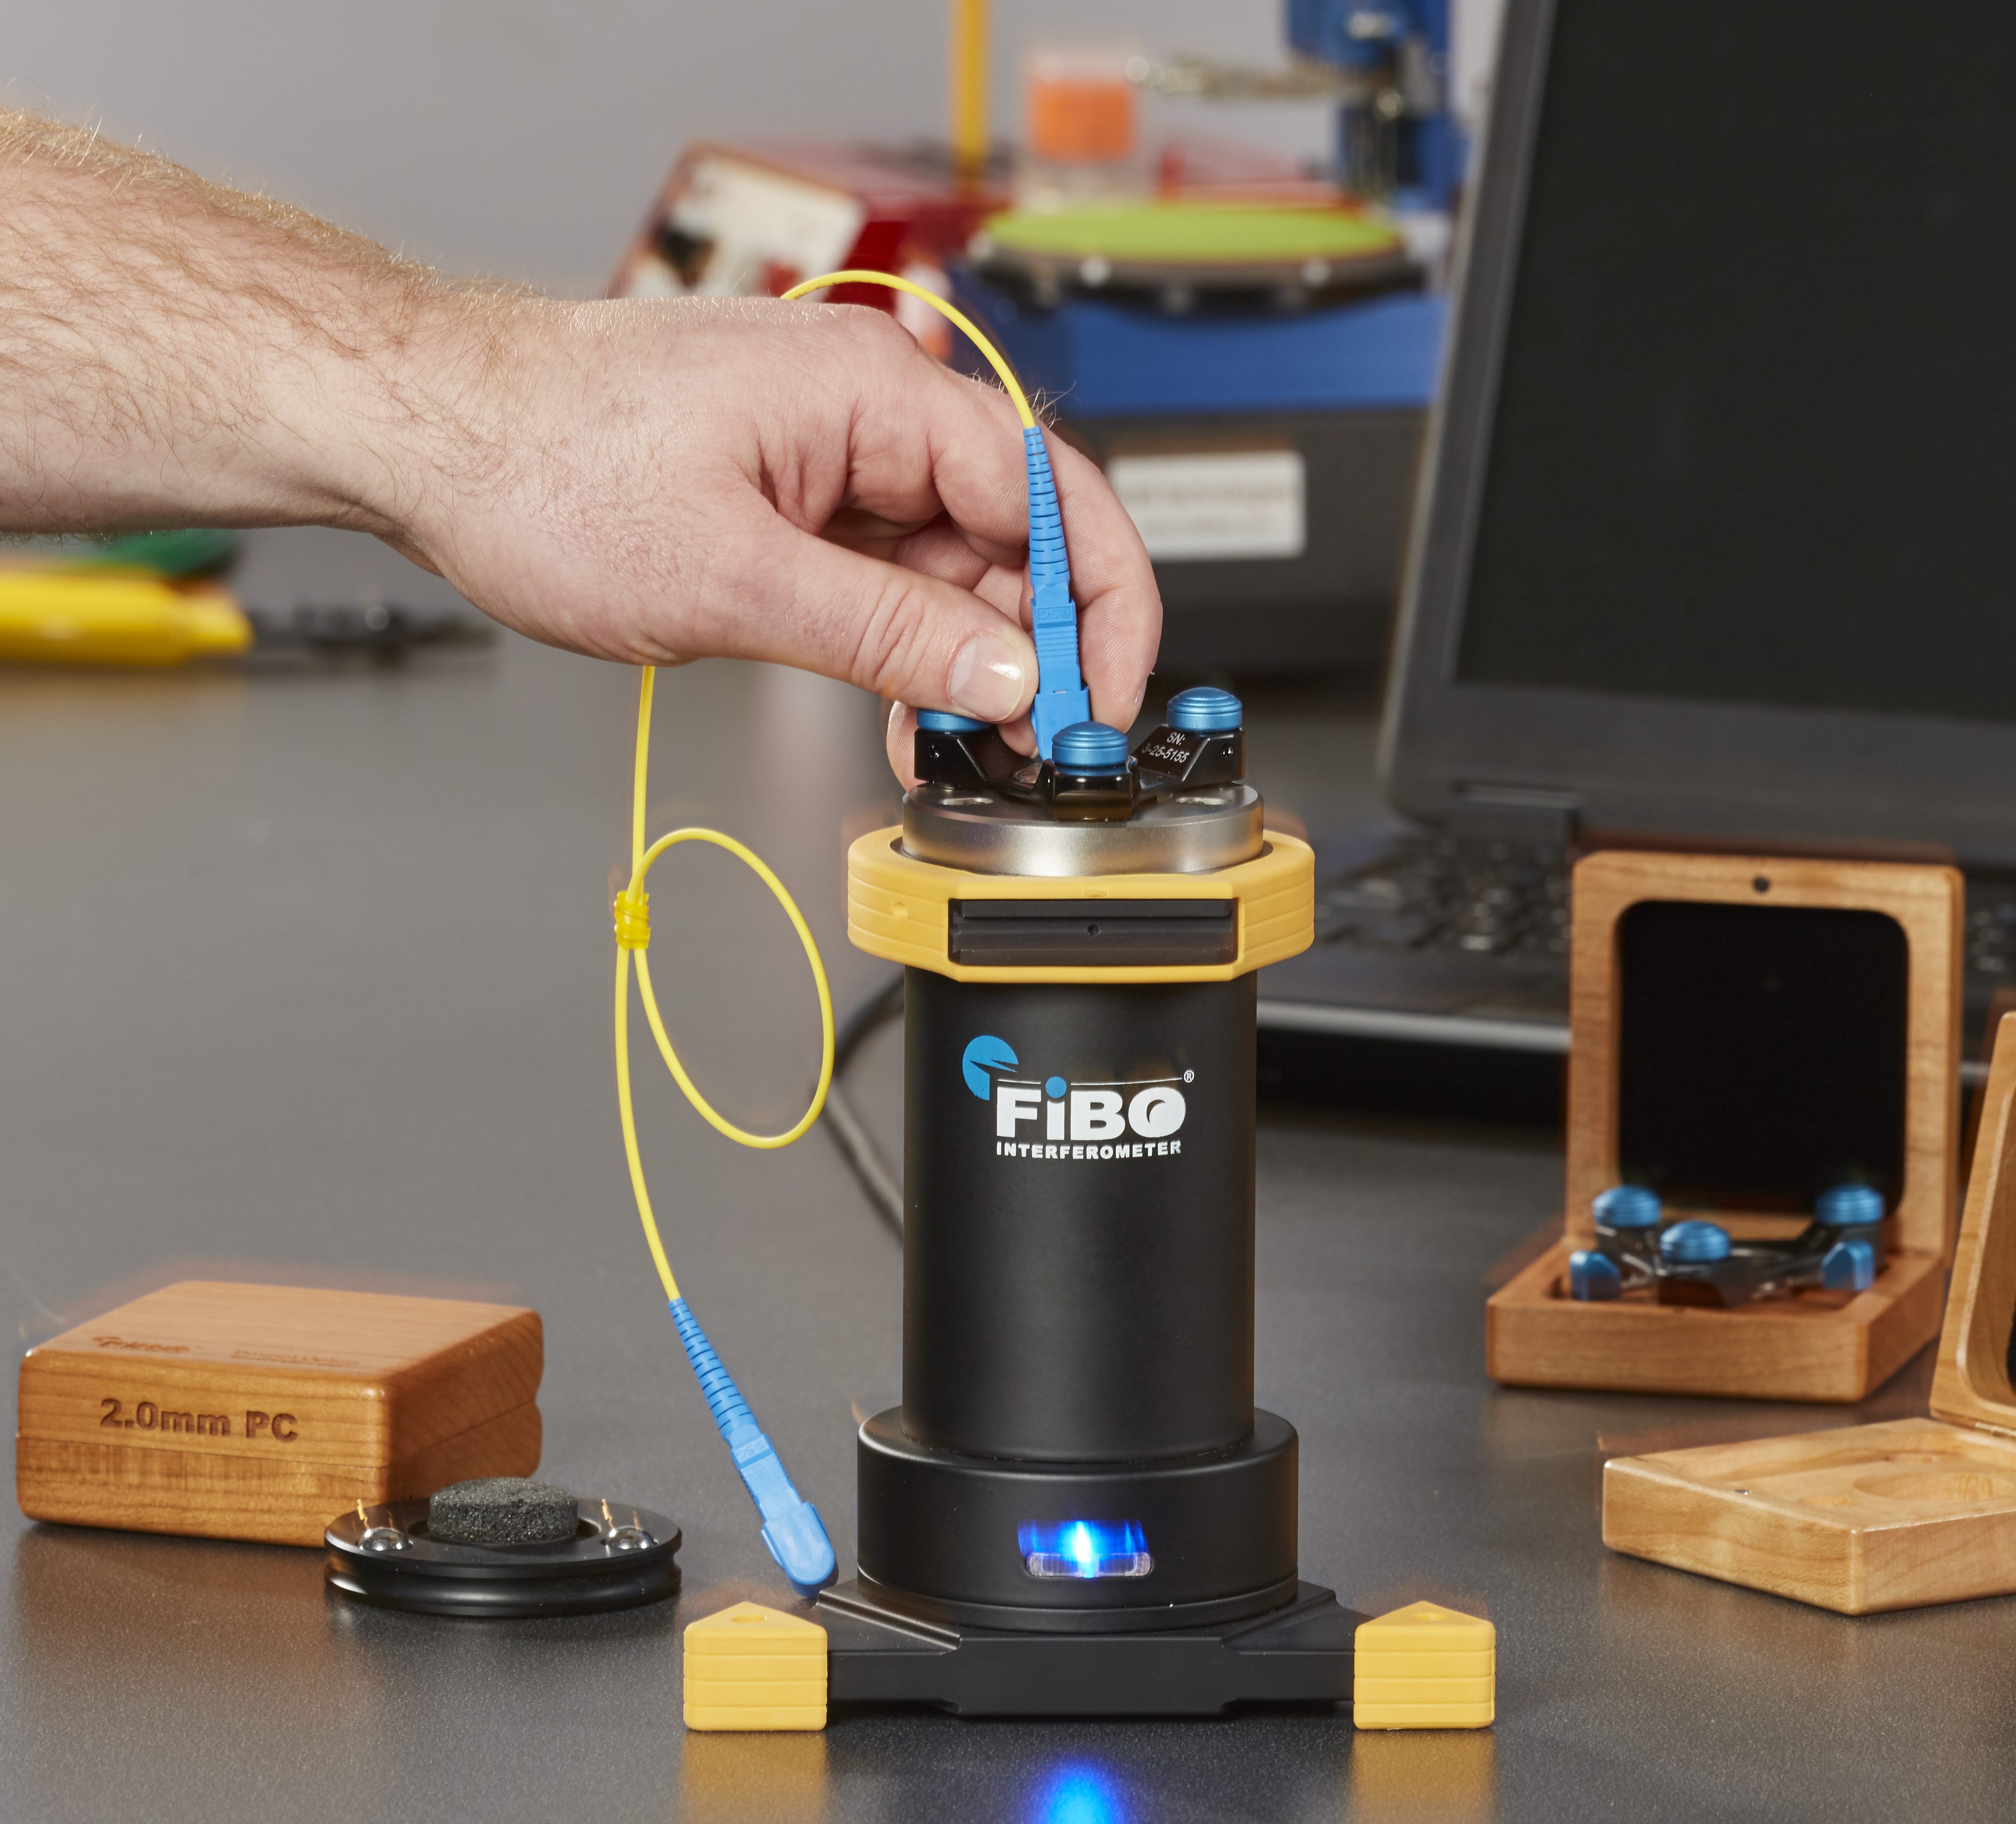
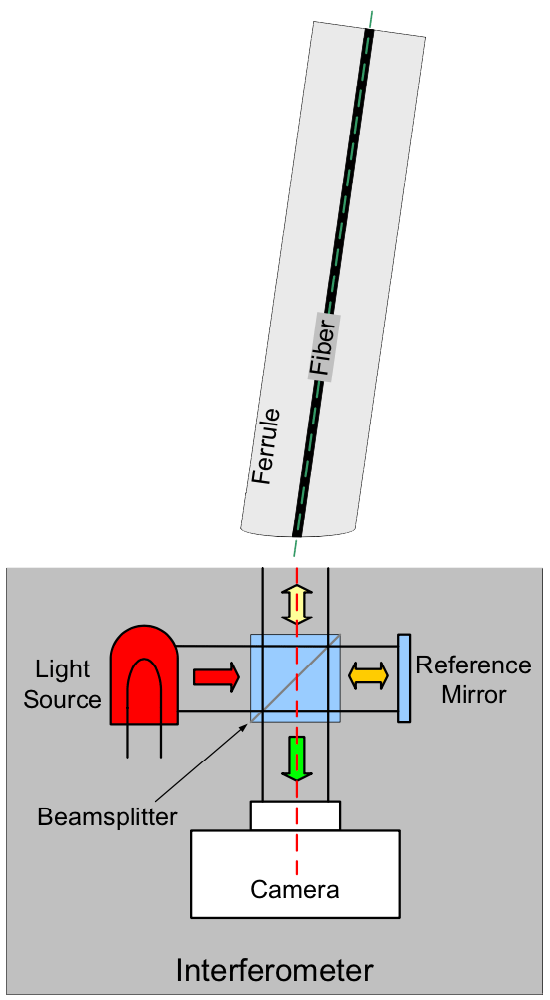
In order to measure the three-dimensional (3D) properties of a physical contact (PC) connector endface, the axis of the ferrule of the connector (green dashed line) is aligned parallel to the optical axis of the interferometer (red dashed line), as in the following diagram:
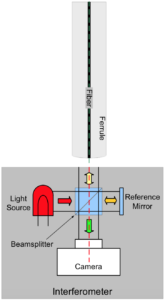
Fig. 1: Interferometer configuration for measuring the endface of a PC connector
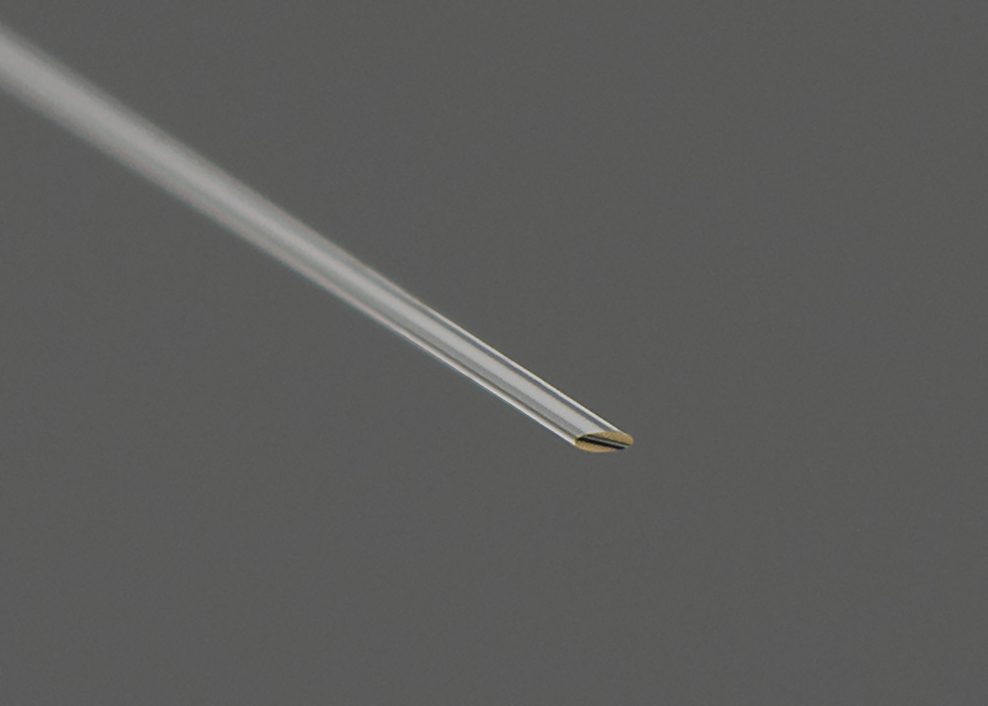
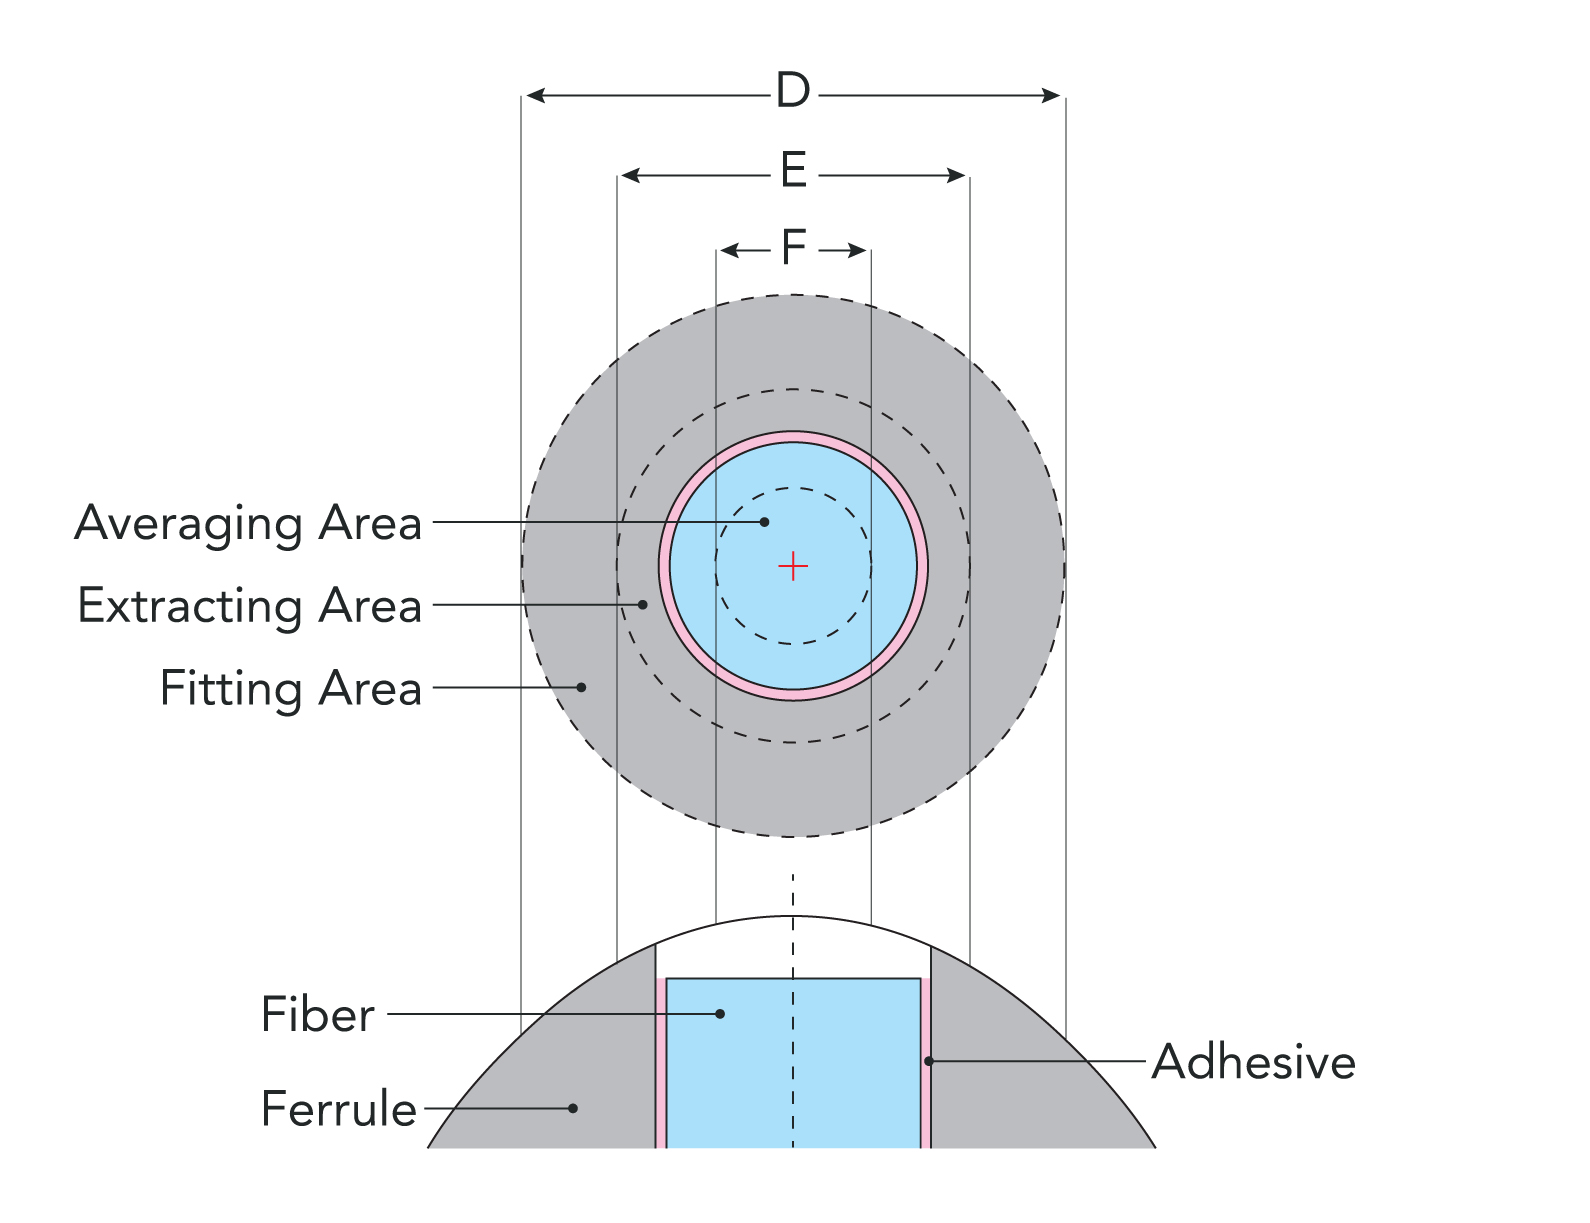
Using the microscope mode of the interferometer (with the reference mirror blocked), the center portion of the connector endface appears as follows:
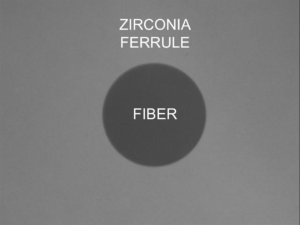
Fig. 2: Microscope image of a connector endface (with the fiber and ferrule areas labeled).
Switching the device into interferometric mode by unblocking the reference mirror introduces interferometric fringes to the image:
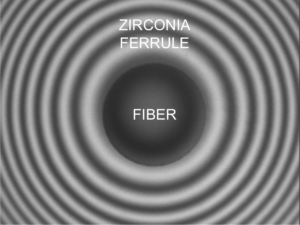
Fig. 3: Interferometric image of a connector endface.
The circular fringes are a result of the interference between the light reflecting from the spherical shape of the connector endface and the light reflecting from the flat reference mirror. Even without obtaining quantitative 3D measurements by performing phase-shifting interferometry, some properties of the endface can be observed by interpreting the fringe pattern:
-
- If the fringes are irregularly shaped, the surface of the ferrule is irregular.
- The spacing of the fringes is directly related to the radius of curvature of the endface: the larger the spacing of the fringes, the larger the radius of curvature.
- The linear apex offset is directly related to the distance between the center of the fiber and the center of the fringes. If the two centers overlap, there is minimal linear apex offset.
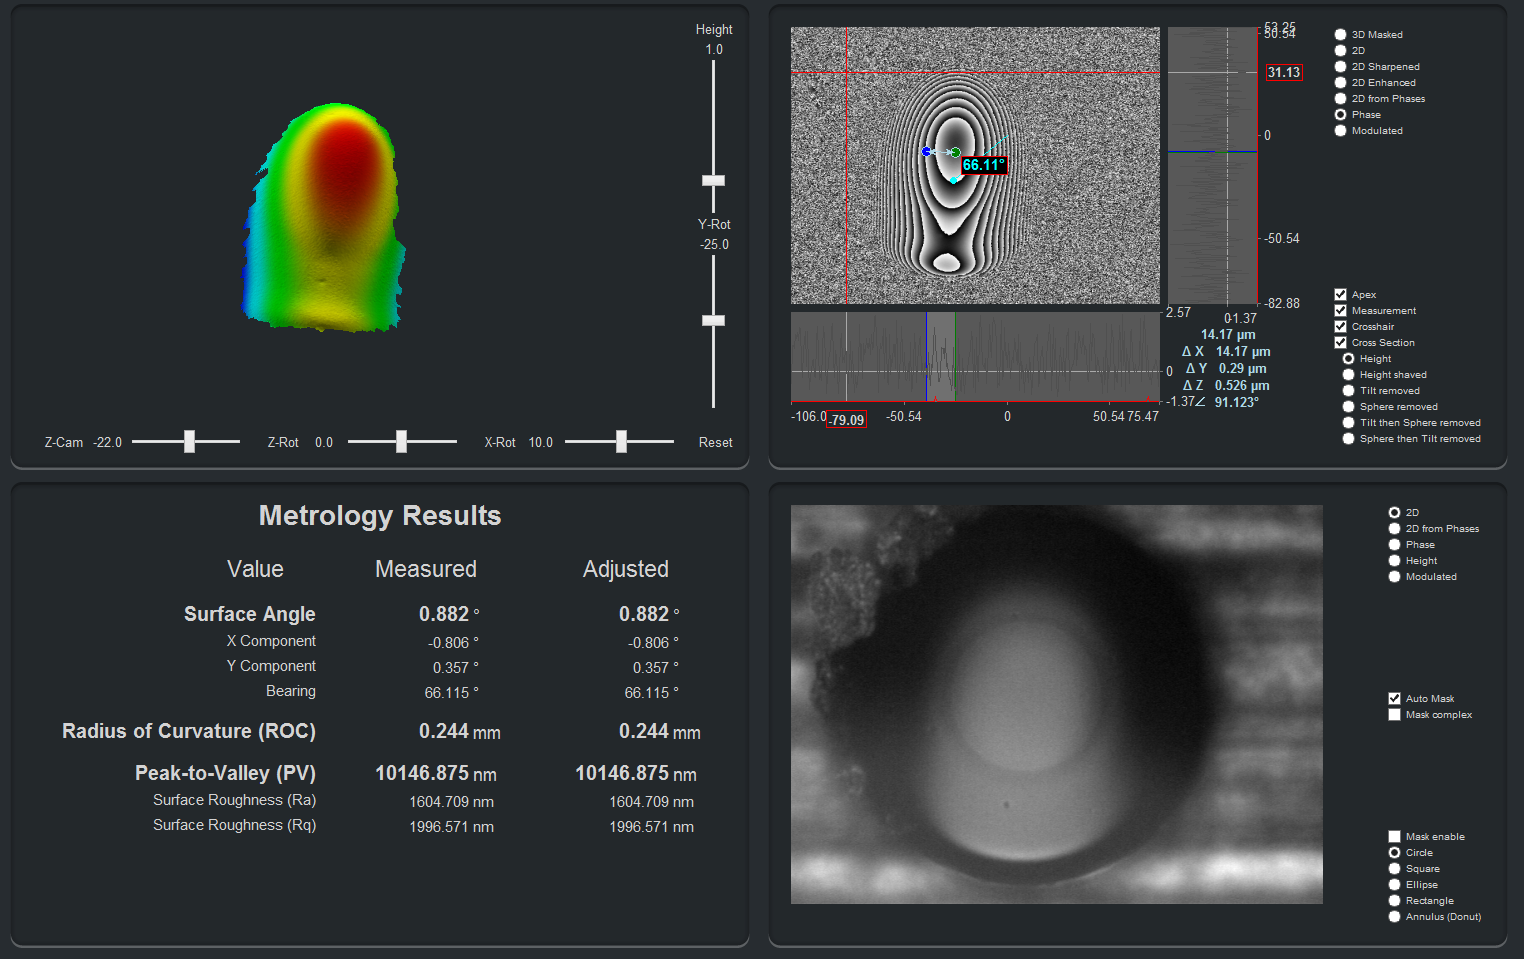
The visual interpretation of fringes can be informative, but by using phase-shifting interferometry, the 3D shape of the endface can be measured and concrete numbers for parameters such as Radius of Curvature, Fiber Undercut/Protrusion and Linear Apex Offset can be objectively calculated:
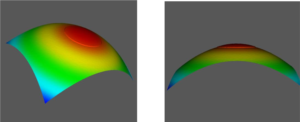
Fig. 4: 3D images of a connector endface with measured values of: Radius of Curvature = 13.5mm, Spherical Fiber Height =50nm and Linear Apex Offset = 5.0 microns.
Relationship between Linear and Angular Apex Offset
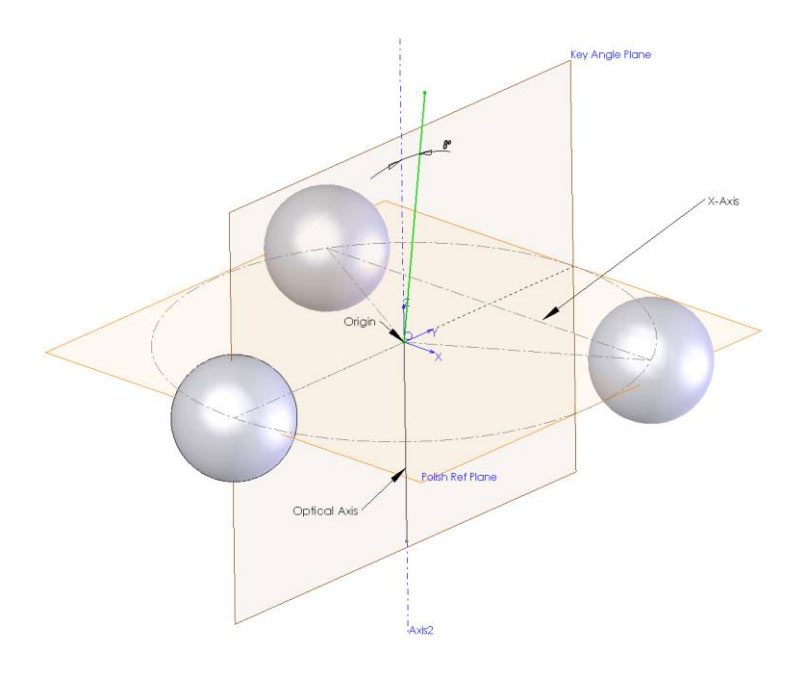
The TIA-455-218 document describes how to use the three-dimensional data acquired with an interferometer to calculate the Radius of Curvature, Linear Apex Offset and Fiber Undercut/Protrusion. Linear Apex Offset is the horizontal distance, in microns, between the center of the fiber and the peak of the polished sphere of the connector endface. The connection between Linear Apex Offset and Angular Apex Offset can be seen in the following diagram:
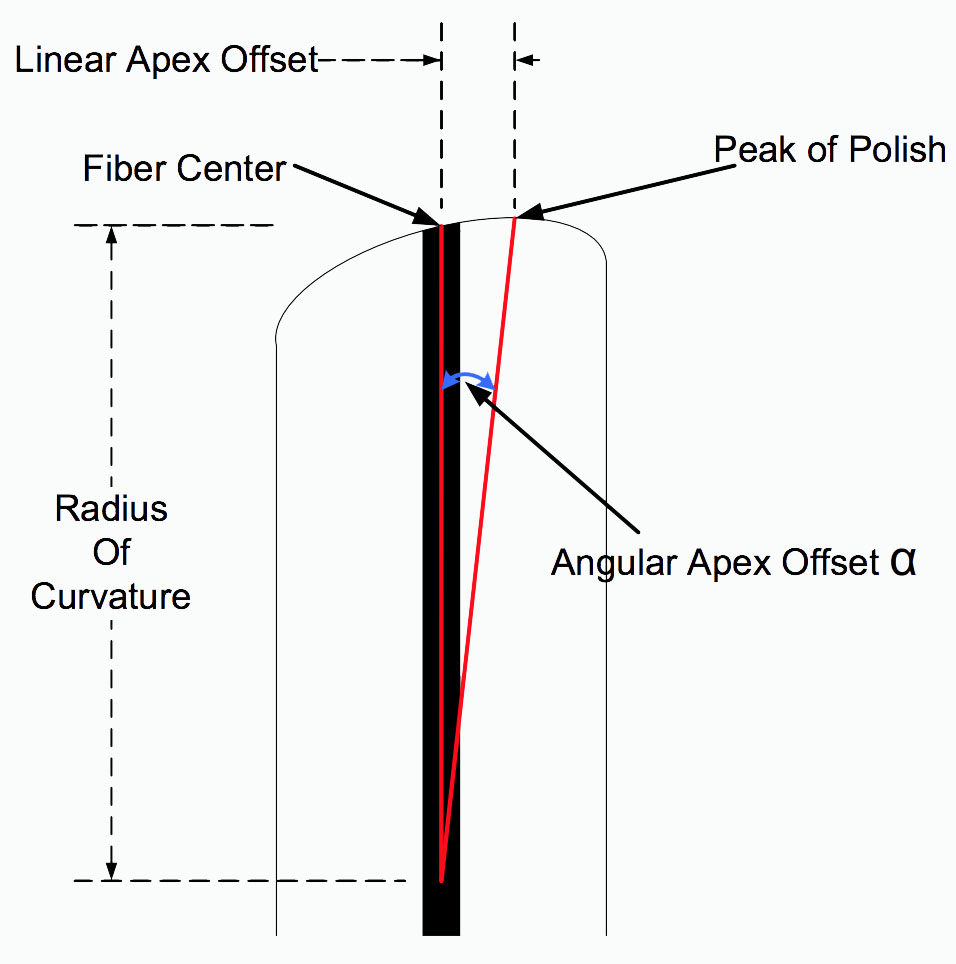
Fig. 5: Exaggerated connector side-view cross-section showing Linear and Angular Apex Offset.
The thick black line represents the fiber.
The TIA document also gives the mathematical relationship between the measured Linear Apex Offset and the calculated Angular Apex Offset as:
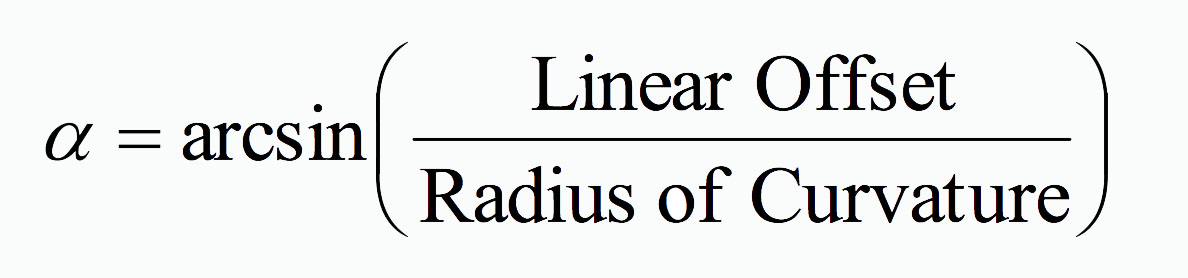
From the above equation we can see the non-linear relationship between the Radius of Curvature and the Angular Apex Offset. This relationship is displayed in the following graph for a given Linear Apex Offset of 50 microns (a typical maximum allowed value):
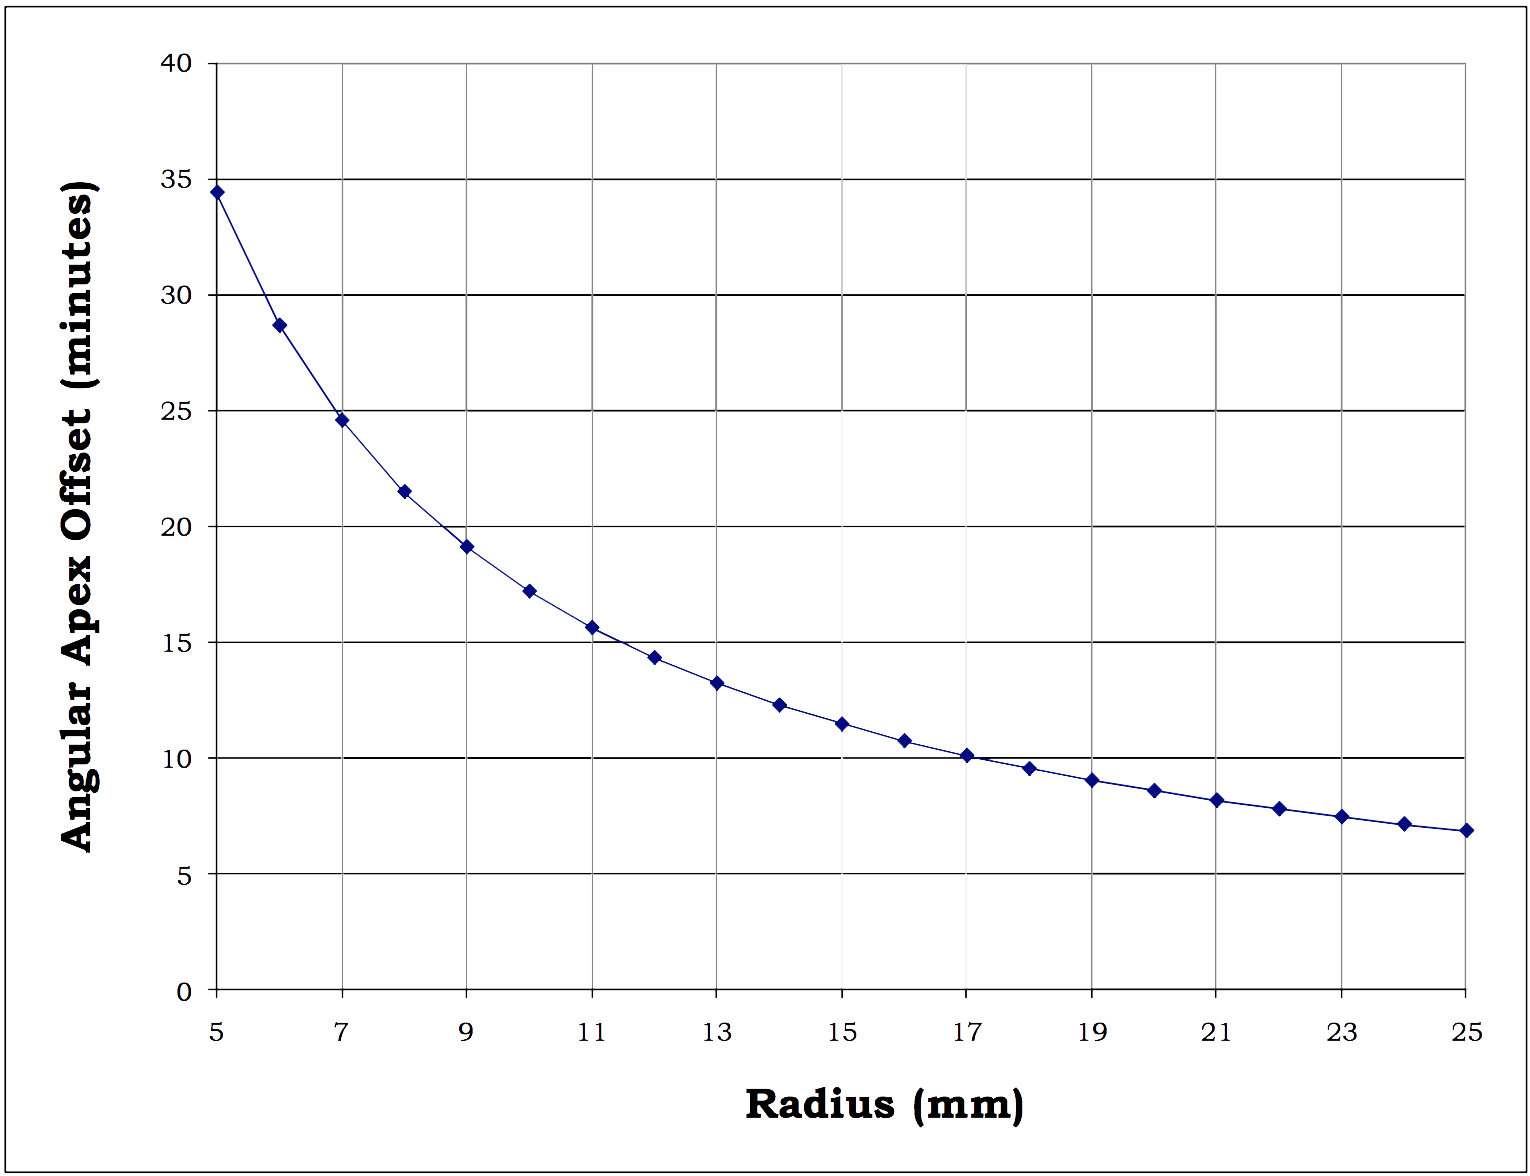
Fig. 6: Relationship between Angular Apex Offset and Radius of Curvature for a given Linear Apex
Offset of 50 µm
The graph above illustrates that for a given Linear Apex Offset, as the Radius of Curvature increases, the Angular Apex Offset decreases.
Because of the spherical nature of the connector endface, the interferometer cannot tell the difference between any fixturing errors (when the ferrule of the connector is not exactly perpendicular to the plane of the interferometer) and polishing errors causing the apex to not be centered over the fiber. Thus we can see from the relationship between Linear and Angular Apex Offset that for PC connectors these angular fixturing errors will lead to excess Linear Apex Offset being reported.
As the Radius of Curvature of the connector’s endface increases, these angular errors result in larger Linear Apex Offset errors. This relationship is depicted in the following graph:
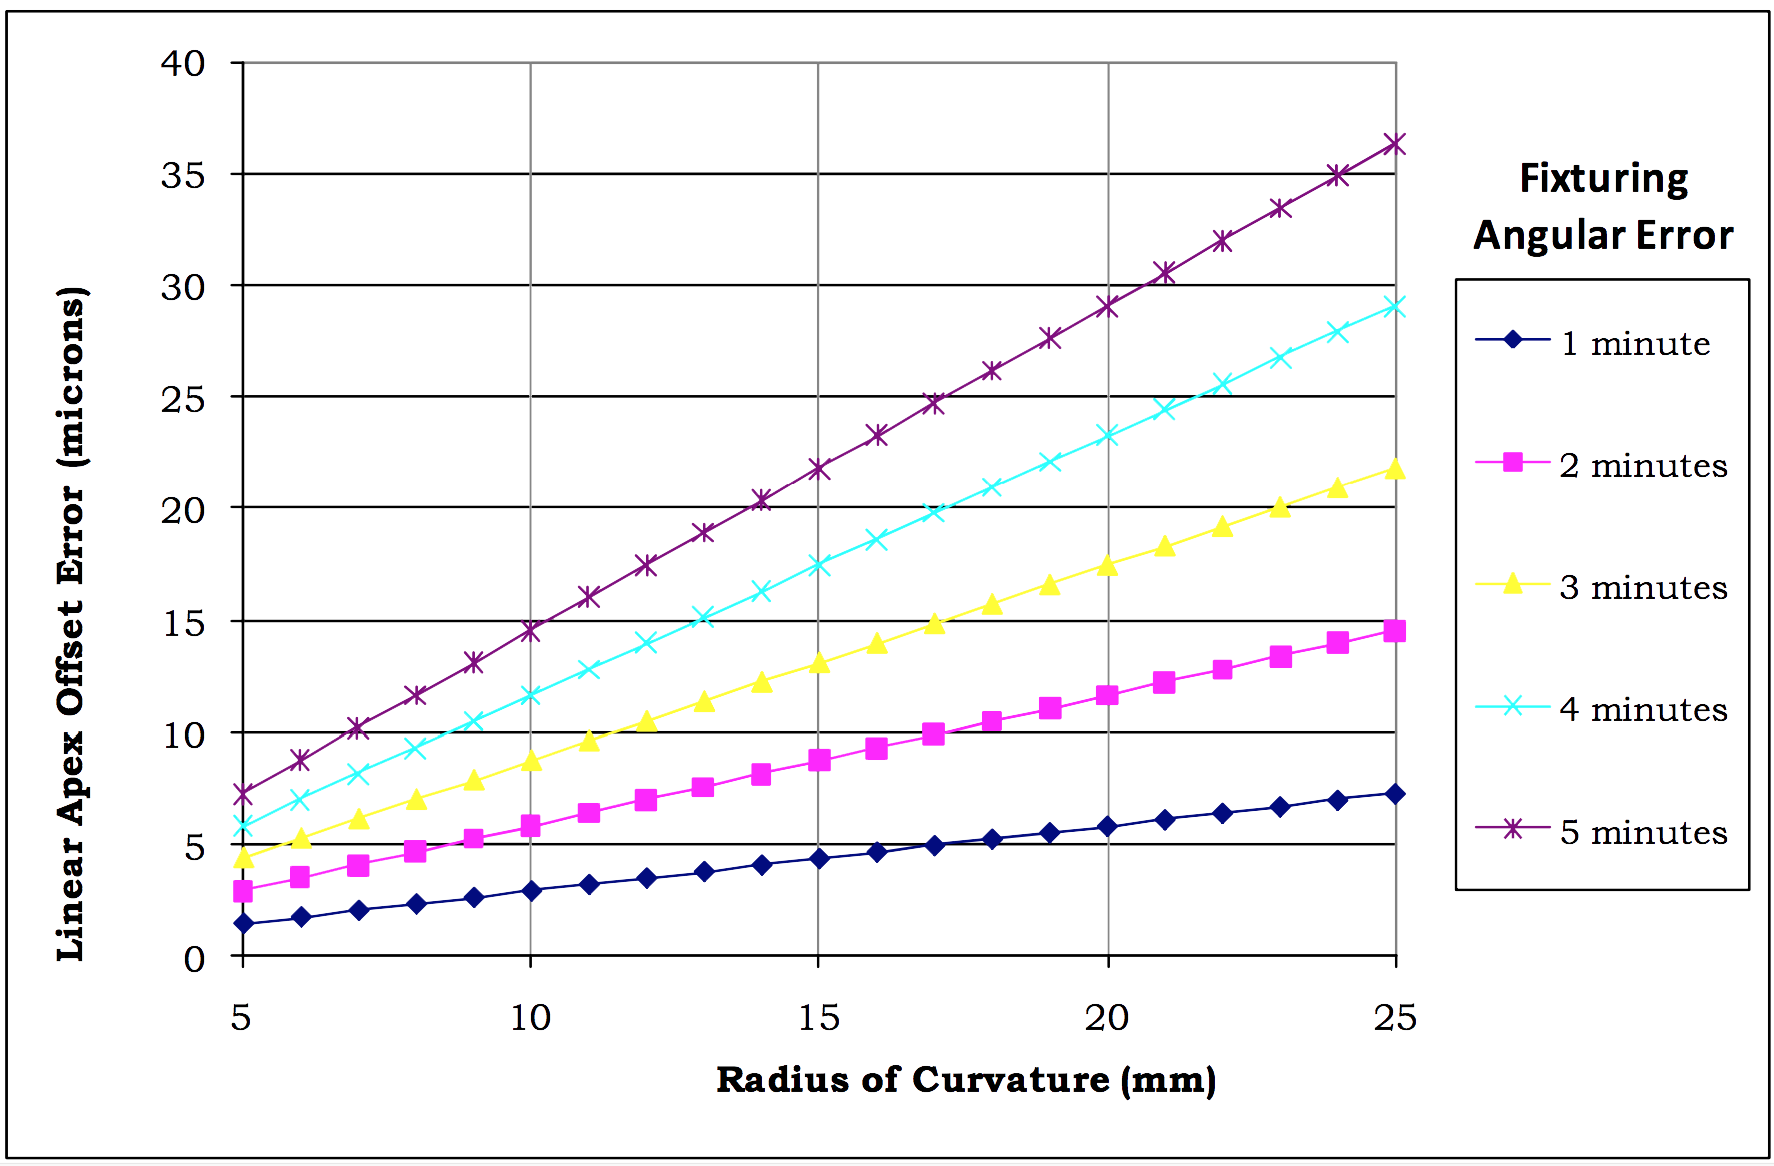
Fig. 7: Graph of relationship between Linear Apex Offset Error and Radius of Curvature for different
fixturing angular errors.