ENDFACE TESTING
Made by Promet Optics

This is the third of a four-part post from the white paper entitled “Variation in Linear Apex Offset Measurements of Angled Fiber Optic Connectors”.
Theoretical Angle Relationships for Rotating APC Ferrule
Derivation
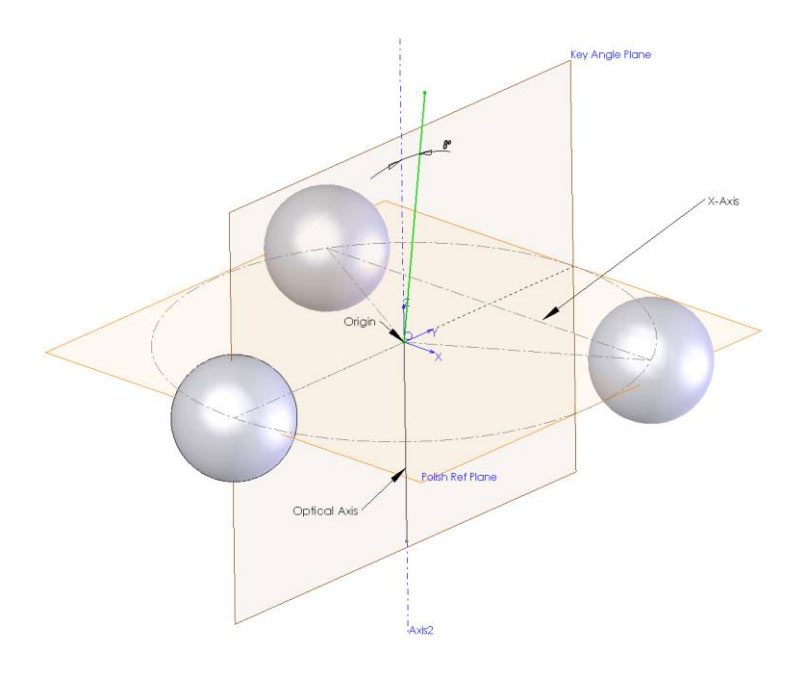
The following diagram represents a non-rotated APC ferrule that has been properly tilted relative to the axis of the interferometer (red dashed line). The ferrule is shown in the diagram with a green dashed line representing its axis. The spherical endface of the ferrule is a small portion of a larger, theoretical sphere illustrated by the dashed circle in the diagram. Note that the lowest part of the circle representing the ferrule endface polish radius is at the same location as the ferrule (and fiber) center thus giving zero apex offset.
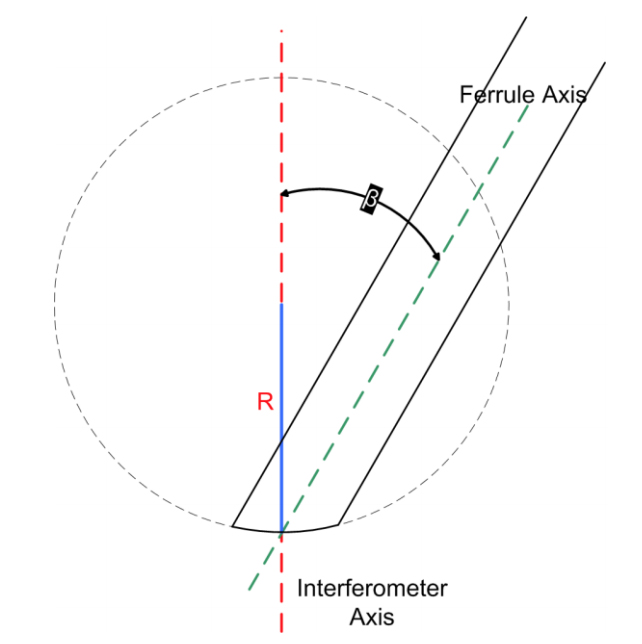
Fig. 14: Exaggerated diagram of a non-rotated APC ferrule with zero apex offset error. β is the polish angle, R is the radius of curvature.
If this ferrule is rotated 180° about its axis (the green dashed line), the following diagram results:
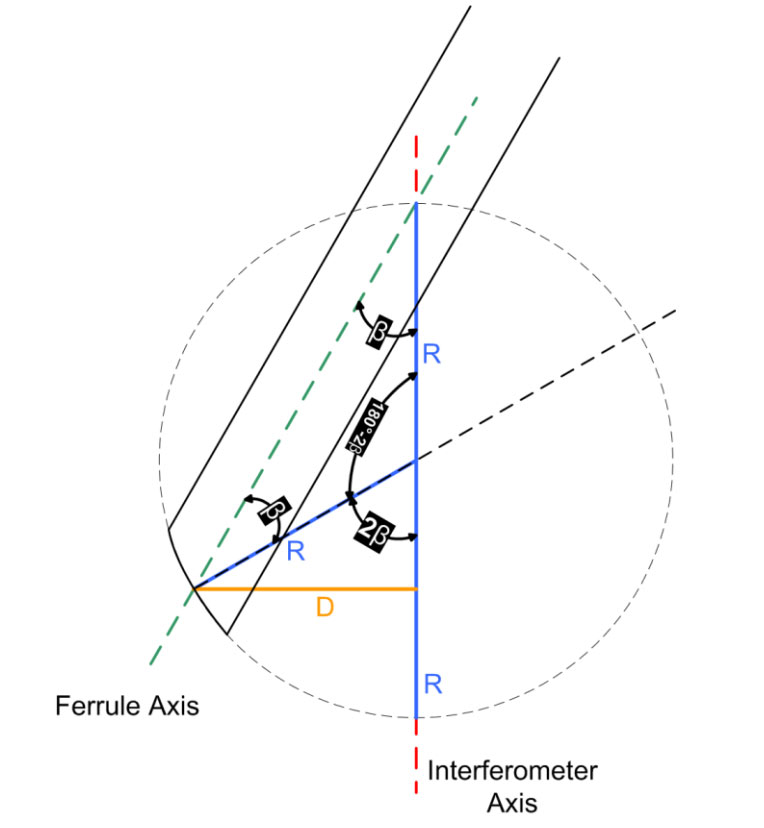
Fig. 15: Exaggerated diagram of APC ferrule rotated 180° about ferrule axis. β is the polish angle, R is the radius of curvature and D is the horizontal distance between circle minimum and center of ferrule.
Now the lowest point of the circle representing ferrule endface polish is not located at the same point as the ferrule center, but is a horizontal distance D away. This low point of the circle would be the center of the circular fringes if looking at the ferrule surface on the interferometer. The distance between the ferrule center and this low point is the Linear Apex Offset due to rotation of the ferrule. (In reality we could never rotate the ferrule this much and see the low point of the circle because it would be off the surface of the ferrule).
We want to determine the distance D because it describes the diameter of the circle that the minima of the ferrule circle travels as the ferrule is rotated about its axis. The relationship between the angles is determined by the geometry in the above diagram. Looking more closely at the part of the diagram that contains D:
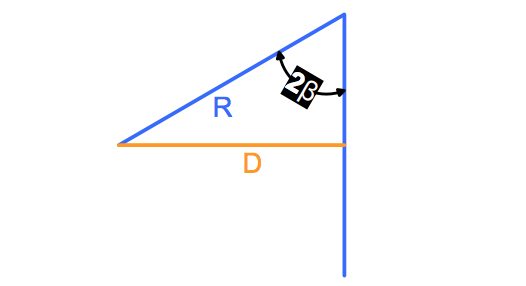
Fig. 16: Zoom in on previous figure containing D.
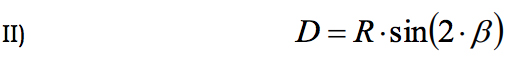
The relationship between D, Radius of Curvature R and polish angle β is then found as:
The circle that the minima travel around describes how the Key Linear Apex Offset changes and looks like:
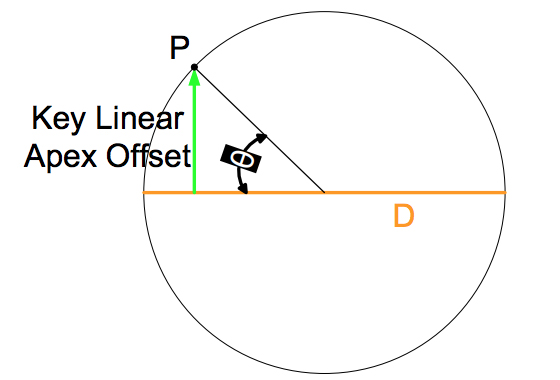
Fig. 17: Circle of Linear Apex Offset created as the APC ferrule is rotated.
D is the diameter of the travelled circle and θ is an arbitrary ferrule Key Orientation Angle where the point P shows the Key Linear Apex Offset in the Y direction. Looking at this diagram we can write the following relationship:
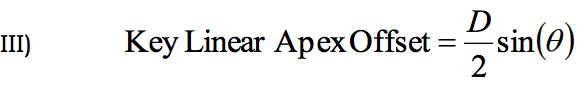
Using equation I that gives the relationship between Linear and Angular Apex Offset, it can be said:
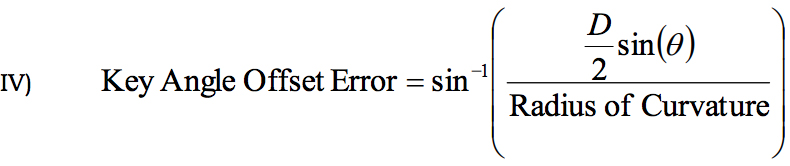
Using the result from equation II and noting R = Radius of Curvature, θ = Key Orientation Angle and β = Polish Angle we arrive at:

Consequently, if the Key Orientation Angle is greater than 90 degrees or less than -90 degrees, the magnitude of the Key Linear Apex Offset will start getting smaller as the ferrule is further rotated, so Equation V is only valid for small angles. This has more to do with the limitations of how Key Angle Error is defined than the rest of the derivation.
Verification
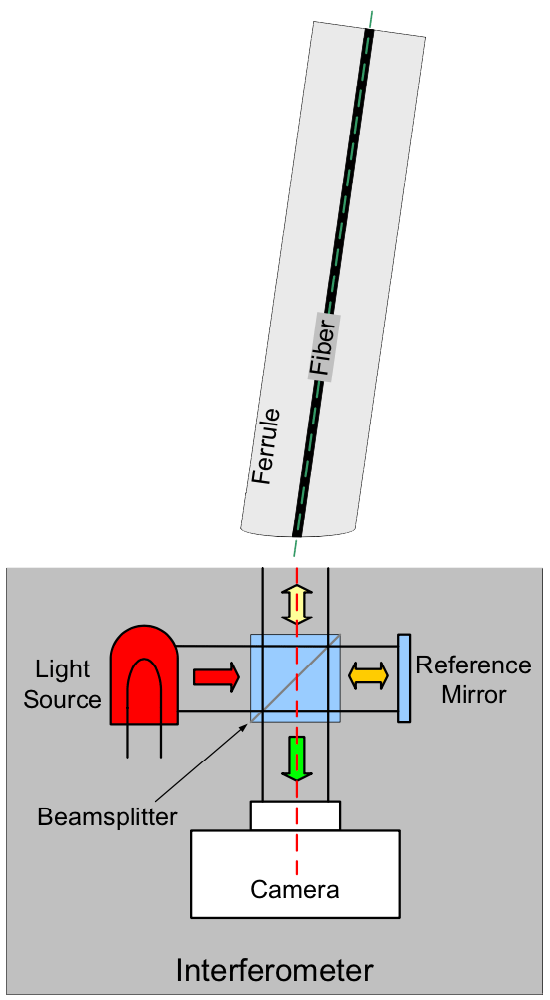
The relationship of Equation V was verified by using an OGP Smartscope® CMM (Coordinate Measurement Machine) to independently measure the Key Orientation Angle of a ferrule while using a PROMET FiBO® interferometer to measure the Angle of Polish and Key Angle Offset Errors. This measurement was repeated for four different ferrules with various radii. The following plot shows the measured relationship between the Key Angle Offset Error and Key Orientation Angle as well as a theoretical line from Equation V using 8 degrees as the Polish Angle:
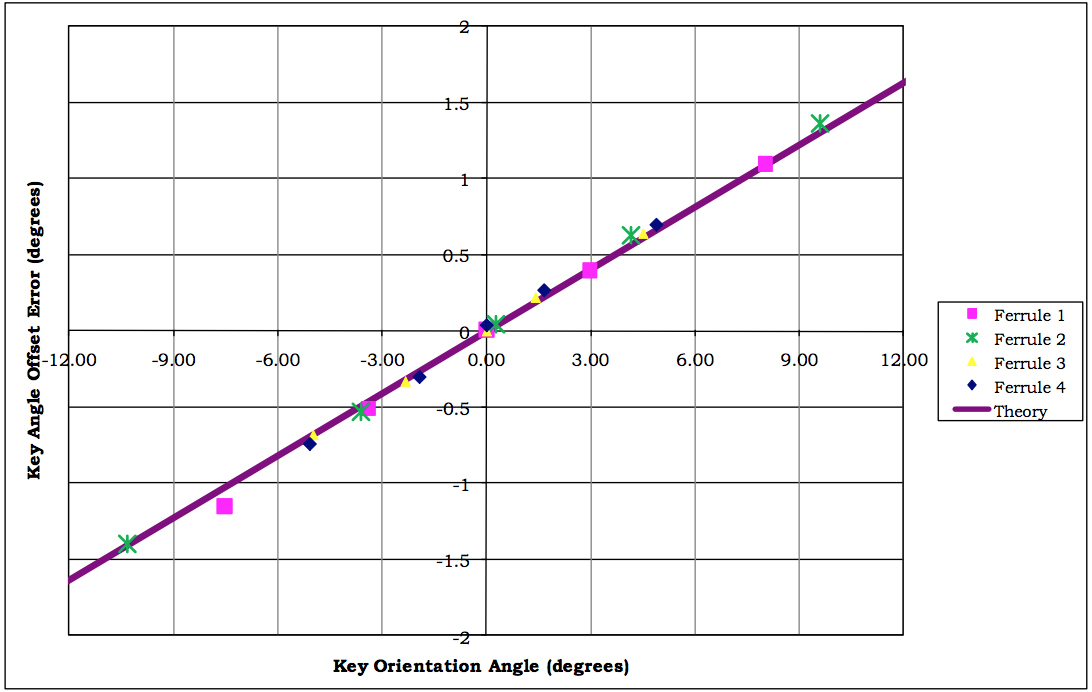
Fig. 18: Key Angle Offset Error vs. Key Orientation Angle.
There is excellent agreement between the measured points and the theoretical line.
Further implications
Equation I, relating the Angular Apex Offset to the Linear Apex Offset and the Radius of Curvature, still holds for angled connectors. Rewriting the equation to solve for Linear Apex Offset results in:
 If it is assumed that the entire Angular Apex Offset is from Key Angle Offset, equations V and VI can be combined to formulate the following equation:
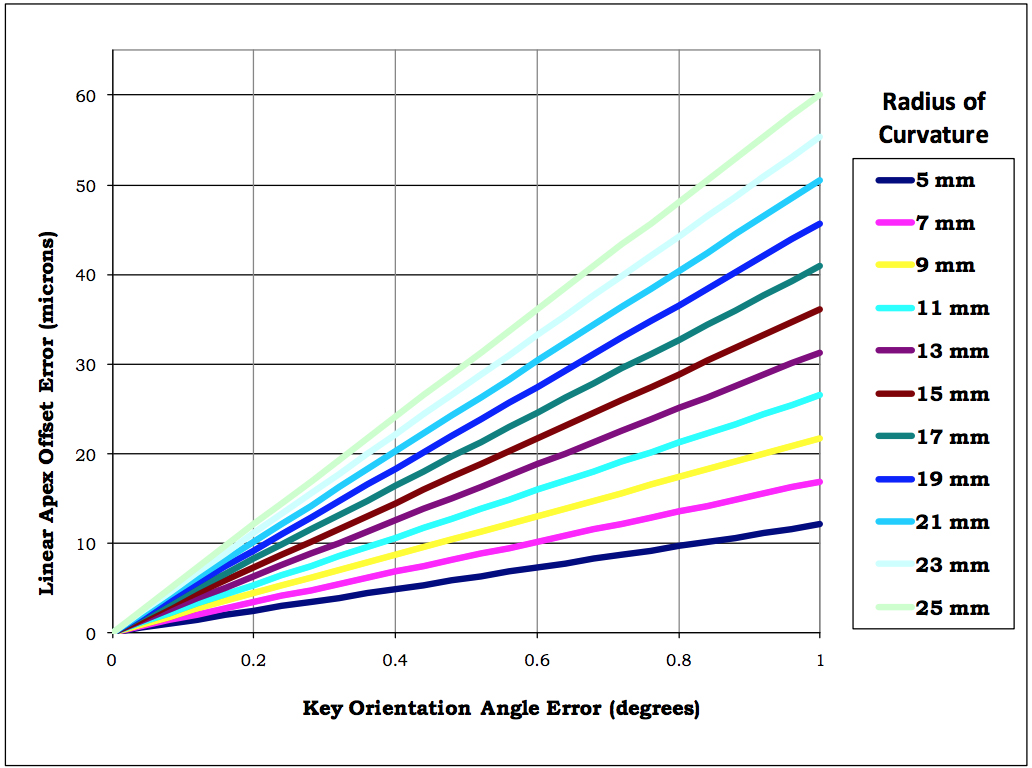
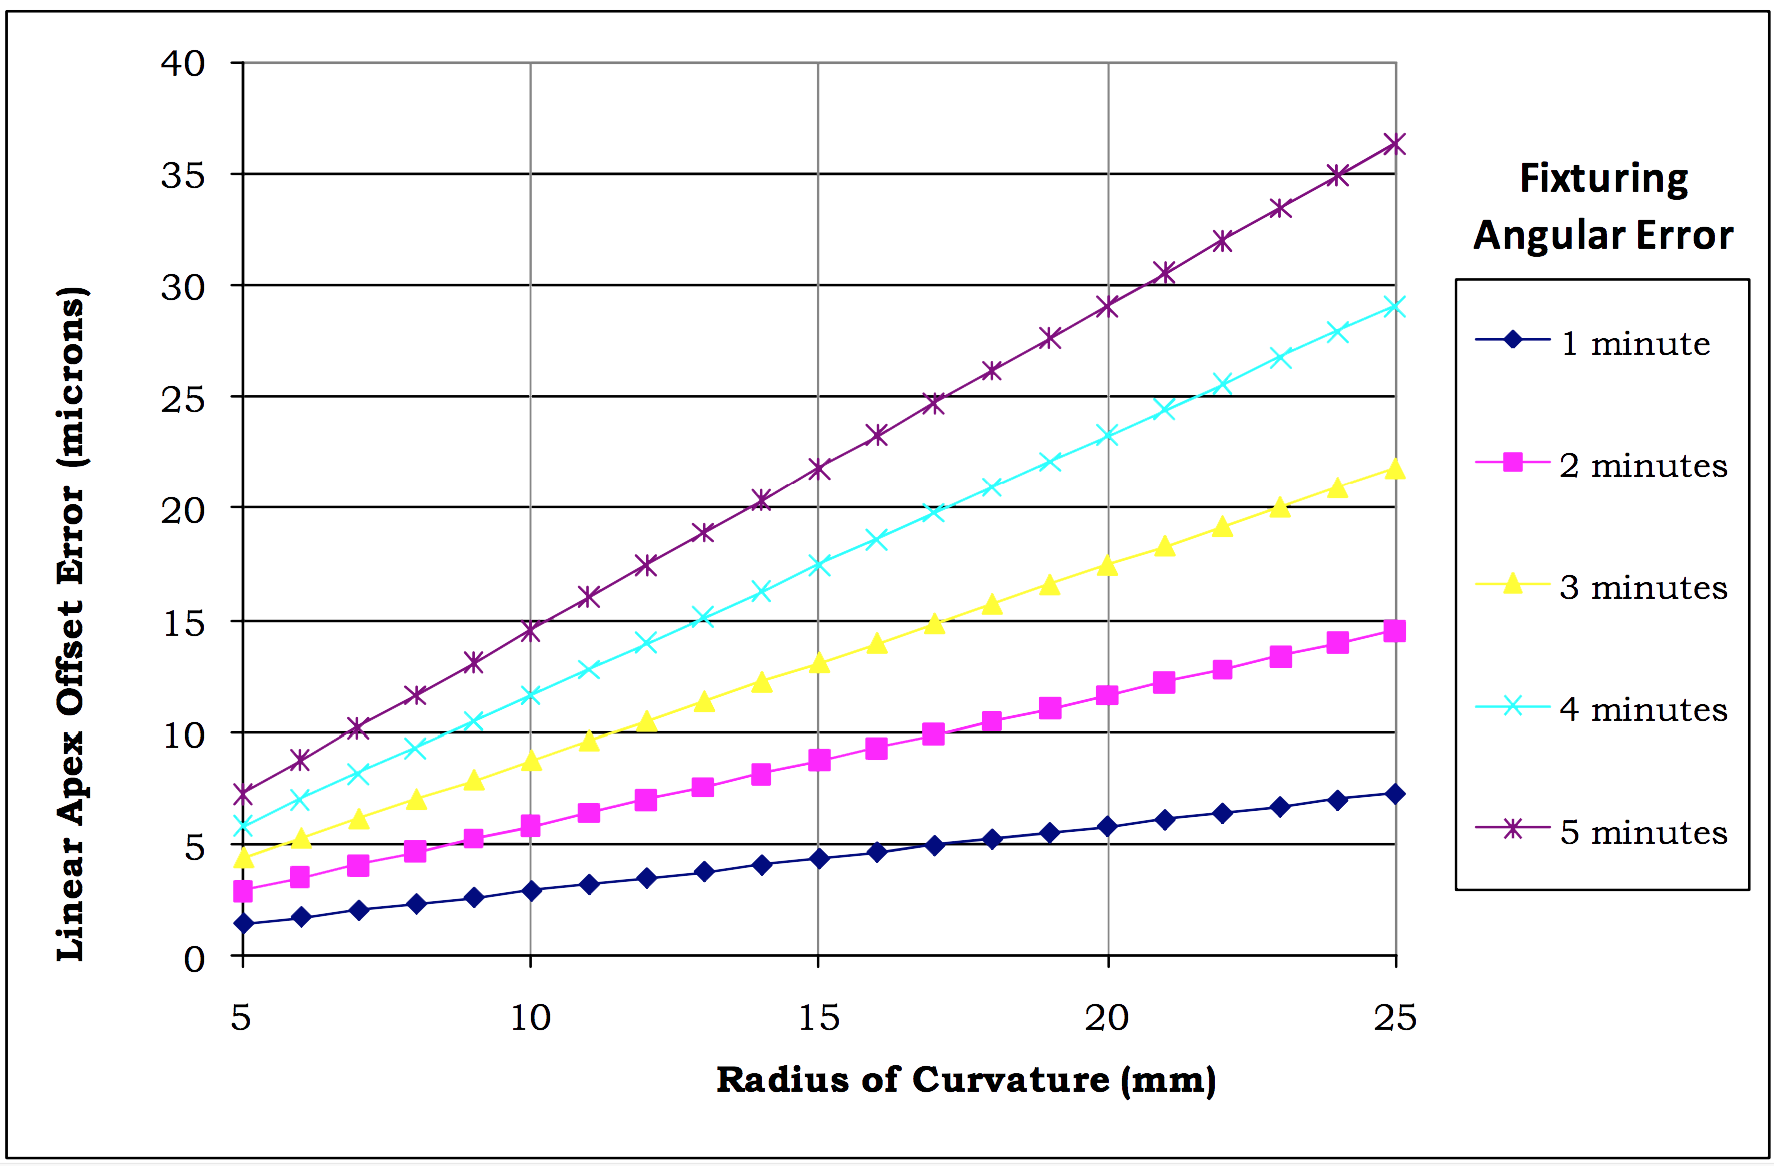
Fig. 19: Linear Apex Offset Error versus Key Orientation Angle Error for an 8 degree Polish Angle and various Radii of Curvature
This plot demonstrates that as the Radius of Curvature increases, the sensitivity of Linear Apex Offset Error to Key Orientation Angle Error increases. A typical maximum allowed amount of Linear Apex Offset is 50 microns, so problems with Key Orientation Angle Error could use up a large portion of this tolerance, especially for a connector with a larger Radius of Curvature. Any mechanical tolerance interactions that allow the ferrule to rotate relative to the measurement holder will contribute to errors in Linear Apex Offset measurements.
Possible Sources for Key Orientation Angle (KOA) Errors
Some possible sources of KOA errors that can lead to excess Linear Apex Offset measurements include:
- Connectors that intentionally hold the ferrules loose to allow two mating ferrules to rotate for best fit
- Poorly made connectors with keys that do not fit keyways properly or tolerance issues between keys and keyways
- Angle errors caused by the ferrule not being held correctly relative to the optical axis of the measuring interferometer
- Angle and measurement errors in the interferometer itself
To examine possible error source #1, measurements were made by firmly clamping ferrules in a FiBO® clamping adapter and then rotating the outside plastic of the connector that contains the key. The angle that the key rotation varied was then measured on a Smartscope®. Here is an example of what this rotation looks like from along the ferrule axis using the video microscope capabilities of the Smartscope®:
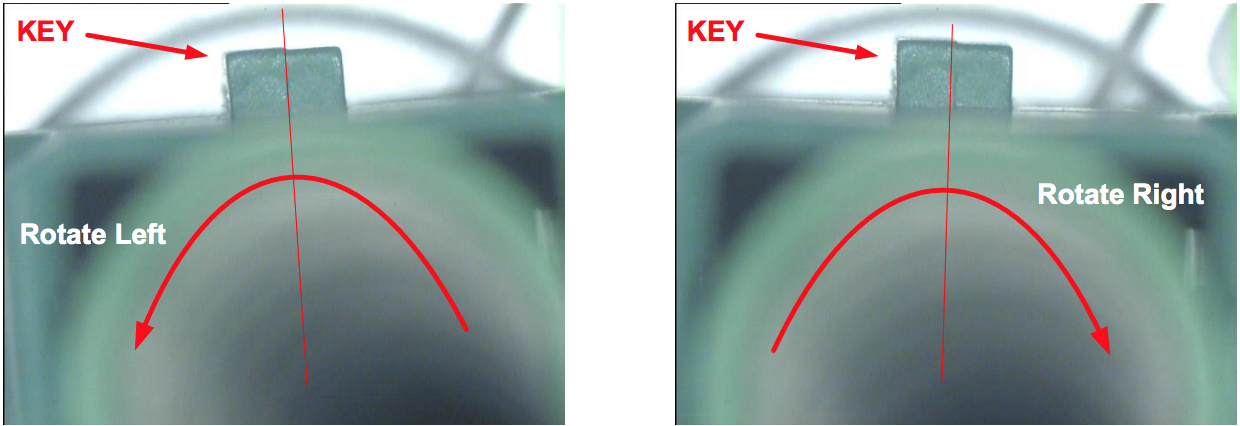
Fig. 20: Microscope images of SC/APC connector body being rotated Left and Right with ferrule firmly clamped. Note the oddly shaped key as well.
A variety of LC and SC connectors (both PC and APC) from different manufacturers were measured using this method. This survey was by no means comprehensive of all manufacturers nor all connector types, but the results showed a surprisingly wide range of angles as can be seen in the following table:
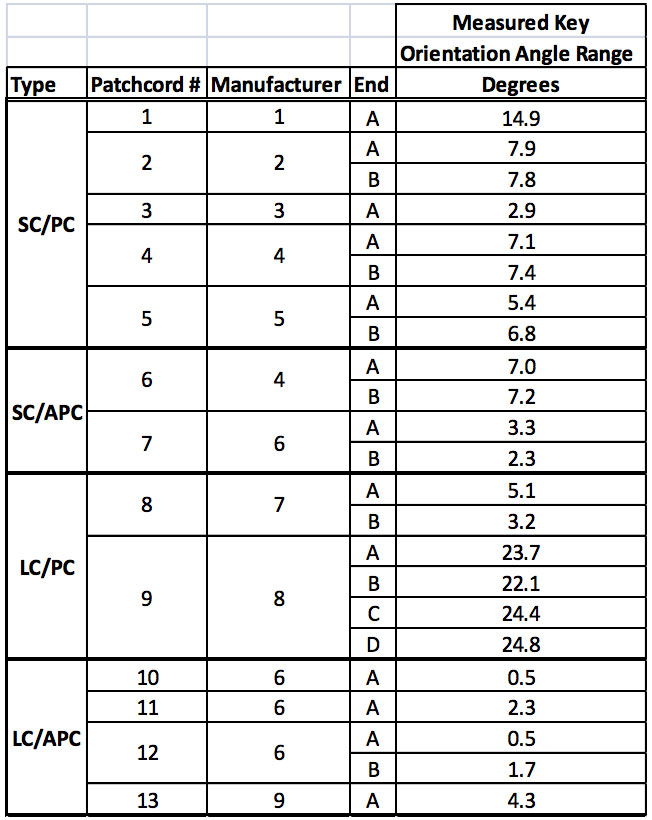
Table 1: Measured Key Orientation Angle for different brands and types of connectors
LC/APC connectors from one manufacturer had Key Orientation Angles that varied only ± a few tenths of a degree while LC/PC connectors from a different manufacturer had KOAs that varied by more than ±12 degrees. Most of the other connector brands had KOA’s that varied by ± a few degrees.
A few degrees may not sound excessive, but as we saw in the graph in Fig. 19, one degree of KOA error can lead to many tens of microns of Linear Apex Offset error.